Page loading ... Please wait Seite wird geladen ... bitte warten  |
Page loading ... Please wait Seite wird geladen ... bitte warten |
 |
 |
|
|
|

|
|
|
|
|
 |
|
| | ||||
|
PRAKLA-SEISMOS Report 3 / 1974
|
||||
| THE PRESENT ISSUE 3/74 | ||||
|
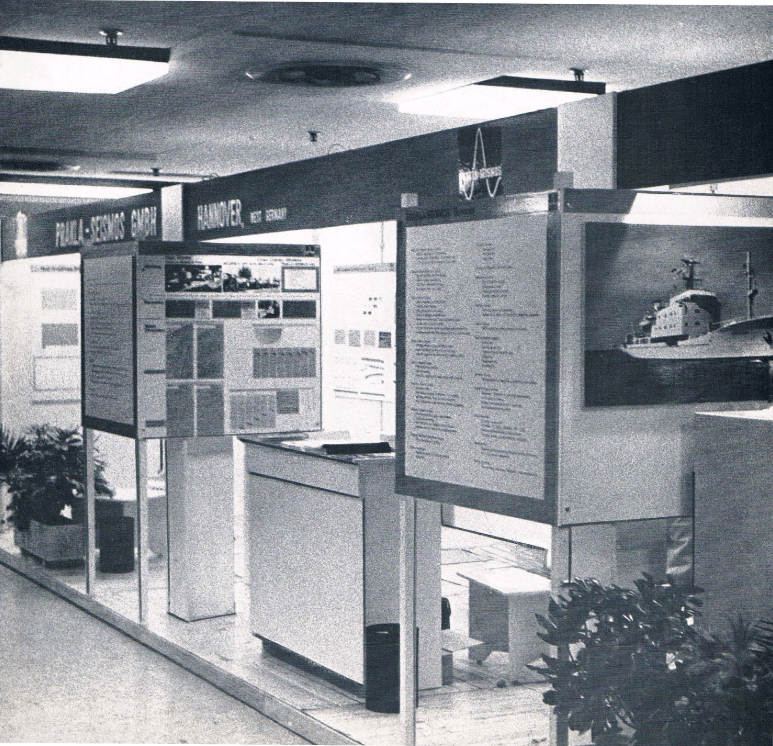
of our PRAKLA-SEISMOS Report is different from all others before insofar as it contains only one text and only one pictorial report. At the beginning of 1974, Prof. Dr. Th. Krey read a paper "Modern Aspects in Exploration Seismics" at the "Free University, Berlin (Freie Universität in Berlin) which gave a general view of the modern developments in applied seismics. Our company had booths at the exhibitions during the EAEG-meeting '74 in Madrid and the SEG-meeting '74 in Dallas with numerous tables displaying our services. Most of theese tables are represented on the following pages the majority of them serving as reference to the themes of Th. Krey's text. Thus, the paper and the pictorial report complement each other in an excellent manner. H. J. Körner was responsible for the organization of the two exhibition booths. He will report on the EAEG-meeting in our next issue 4/74. The Editor | ||||
|
Title page:
|
||||
| | ||||
|
PRAKLA-SEISMOS Report 3 / 1974
|
||||
|
Modern Aspects in Exploration Seismies |
||||
|
If we look back over the time since the introduction of digital seismies, that is the last 8 to 10 years approximately, we note that at the beginning not very many fundamental changes took place. The time domain filter already existed, e. g. the magnetic-delay-line of Seismac. We already had multiple coverage with the required static and dynamic corrections. We had deconvolution in its simplest form, that is the so-called Backus-filter. Of course, with digital seismies all these survey and processing procedures experienced an immediate and significant increase in processing speed and a greater precision. A considerable step ahead, made possible by digital seismies, was the automatie determination of the important parameters in data processing by the digital computer itself. I am thinking mainly of the determination of the deconvolution operator according to Levinson's algorithm by Enders Robinson a.o., of the optimum filter, of the determination of static and dynamic corrections or additional corrections based on correlation -or coherence computations. I mentioned all these things nearly 4 years aga in my paper " Betrachtungen zum Stand der angewandten Seismik" (Observations on the stage of development in applied seismies), which I read in Hannover at a common geophysical colloquium of the Universities of Niedersachsen. Since then quite significant progress has occured or has been initiated, some of which I would like to discuss presently. It was caused by the continued development of the computer with considerably increased storage capacities and computational speed. To be able to assess the advance in applied seismies within the last 4 to 5 years and to foresee the probable future trend, I would first like to recall the basic object of applied seismies. To my feeling it can be described as folIows: |
||||
| | ||||
|
PRAKLA-SEISMOS Report 3 / 1974
|
||||
| VIBROSEIS * | ||||
 From a multitude of time functions -here I mean the seismogram traees recorded at the earth's surface we wish to draw conclusions upon certain properties in the subsurface, those are essentially density and elasticity. That means, we want to determine 1, 2, 3 or more functions in a 3-dimensional space, i. e. in the earth's subsurface. But how many dimensions of observation we have really against these? Firstly we have the time dimension of the seismogram. We have further the possibility to vary independentlyon the 2-dimensional earth's surface the shotpoint or, expressed more generally, the source of the seismic energy, and the observation point, that is the geophon location. Expressed in another way, if we could effect any arbitrary number of observations, we might be able to obtain a 5-dimensional scope of observations: 2 dimensions for the shot location, 2 dimensions for the geophone location and one time dimension. This should result in a redundancy for the determination of density, both the elastic constants and also anysotropy. We should like to keep this statement in mind for later. At first we want to restrict ourselves to considering the 2-dimensional case which corresponds more or less to the classical reflection and refraction seismic surveys that have been carried out along certain lines of the earth's surface. With regard to the field surveys, to begin with, a certain perfection has been achieved as to the recording |
||||
• Trademark of Continental Oil Company |
||||
| | ||||
|
PRAKLA-SEISMOS Report 3 / 1974
|
||||
| Vibroseis Processing | ||||
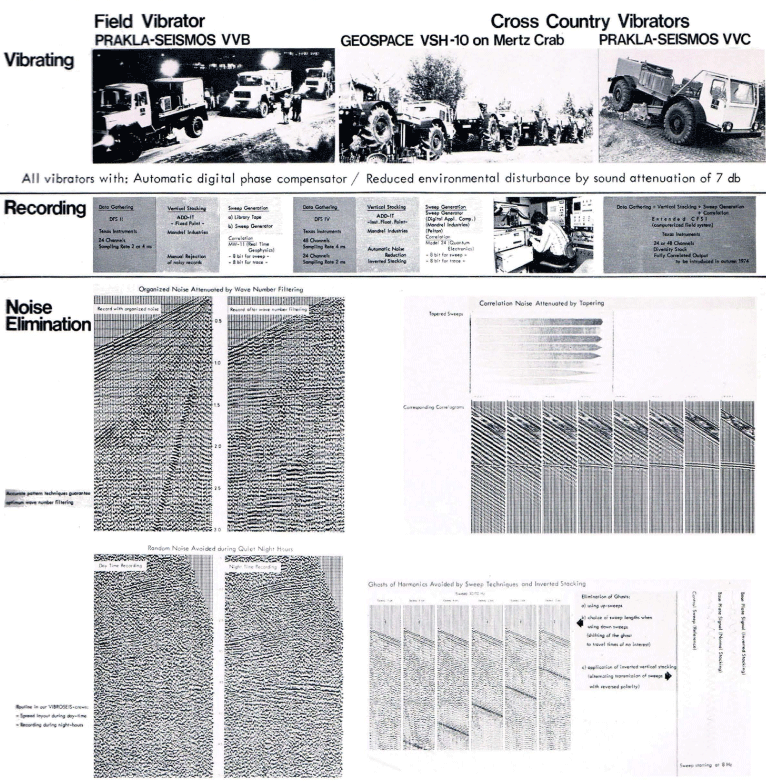
 equipment resulting in the Instantaneous-Floating-PointAmplifier, which as implied by its name, records with a floating point. This recording equipment is fed by socalled digital-grade geophones, that is by geophones whose characteristics have been tailored for the digital recording instruments ; here some development is still in progress. The natural frequencies of the geophones are as low nowadays as 8 or 10 Hz to record the low-frequency portion of the seismogram as perfectly as feasible. We will have something to say on the importance of these lower frequencies later on. On land, dynamite still remains the modern energy source and it will probably stay this way at those piaces where it is easy to pi ace the dynamite below the so-called seismic weathered layer, that is down to the 9round water level or down into more or less consolidated layers. However, at all those places where this is difficult or where in built-up areas explosives cannot be used, the Vibroseis method is increasingly being used (tables on pages 4 and 5) while at sea air pulsers are predominantly being employed. To attenuate ambient noise, ground roll, and other undesired waves, a multiplicity of geophones per amplifier have been used for many years. Considerably greater attention has lately been paid to these geophone patterns than in the past and I think this trend will continue in the future. The wave number filter which results from the |
||||
| | ||||
|
PRAKLA-SEISMOS Report 3 / 1974
|
||||
| Integrated Offshore Geophysics | ||||
 geophone pattern has to be as effective as possible without impairing progress in the field. The same applies to the source of the seismic energy, i. e. the simultaneous shooting from multiple holes and, still more important, the configuration of the vibration points in the Vibroseis system. How the resulting wave-number filter curves may look like nowadays can be seen from figure 1. Why do we apply such care on the attenuation of noise? The reason is, we need records which are to a high degree free from noise and which contain essentially only the reflections from the subsurface, if the desired physical parameters as e. g. elasticity are to be computed from the seismogram traces. We have al ready seen in figure 1 that the noise waves can be attenuated down to -40 dB and better. In contrast, the dynamic range of the recording equipment it some 80 to 100 dB. It is therefore desirable that the noise is attenuated to a still higher degree than by the utilization of multiple geophones and multiple energy sources only. This can be achieved essentially by multiple coverage, that is by stacking seismogram traces with common reflection points. This method is known as common-reflection-point-stacking. We should like to recall that in this method the seismogram traces have to be reduced to zero distance between shot and geophone point before the traces are stacked. This time correction is generally denoted as dynamic as it is time-dependent. |
||||
| | ||||
|
PRAKLA-SEISMOS Report 3 / 1974
|
||||
| Navigation Positioning | ||||
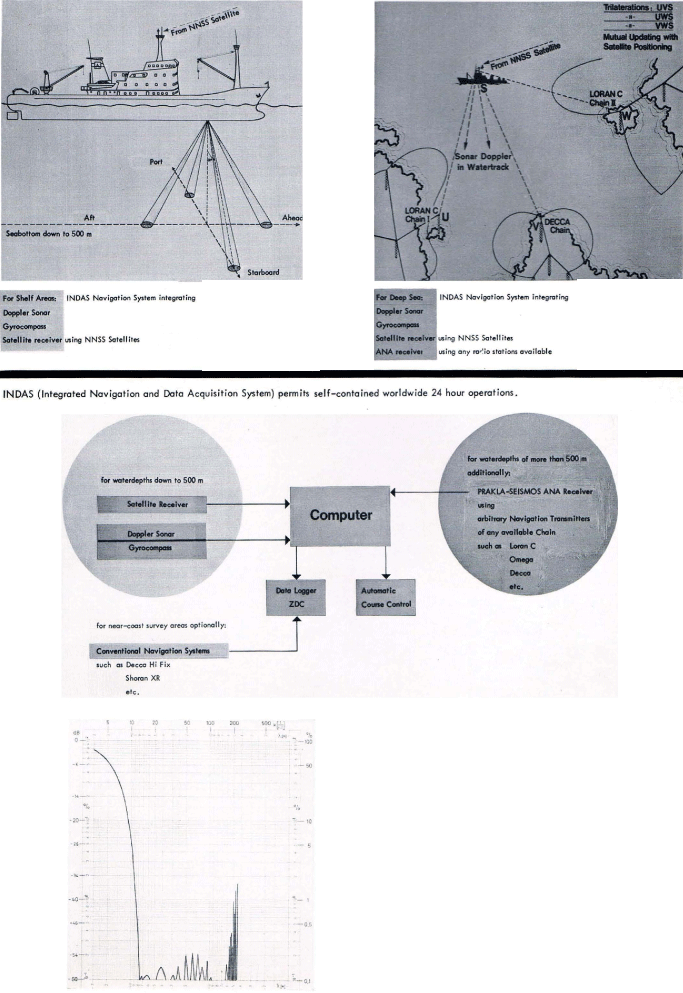 Today the trend is towards a very large multiplicity in Common-Reflection-Point-Stacking in order to bring out the desired reflections. Previously, 6-fold stacking was considered to be normal on land. Today 12-fold stacking is commonly applied and very often it is extended to 24-fold stacking. In arecent survey, just completed, we applied even 48-fold stacking. At sea, 24-fold stacking is the rule, and very often 48-fold stacking is applied. A further -10 to -20 dB attenuation of noise can quite readily be achieved with such high degrees of stacking. The Common-Refection-Point-Stacking is, however, not only suitable for the attenuation of ambient noise or of ground roll but it also attacks multiple reflections. This is |
||||
| | ||||
|
PRAKLA-SEISMOS Report 3 / 1974
|
||||
| Shallow Water Surveys | ||||
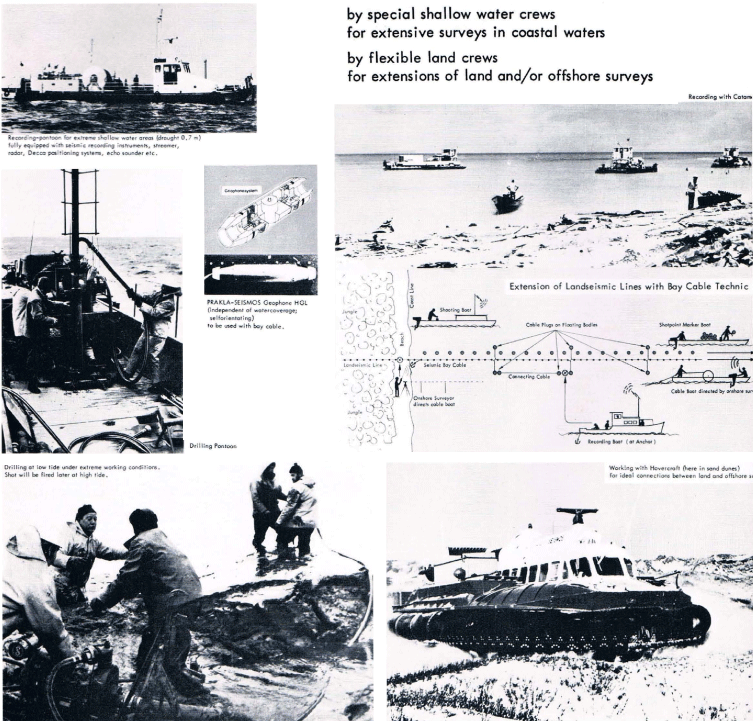 based on the fact that for multiple reflections the socalled dynamic corrections are commonly larger than those for primary reflections which arrive at the same time. In many cases however, multiple coverage is not adequate to sufficiently attenuate the multiple reflections. Here the cause could be that the differences in dynamic corrections are too small because the velocity differences in the subsurface are only small, or because the upper horizons are curved concavely upward which significantly reduces the move-out times of the multiple reflections. For all such cases we at PRAKLA-SEISMOS developed an additional data processing procedure, called the LongLeg-Multiple-Attack method. The process consists in a kind of feedback. As to its fundamental idea and effectivity, see PRAKLA-SEISMOS Report 2/74. Multiple coverage can also not be sufficient to attenuate the multiple reflections for another reason, i. e. when the reflection coefficients which are inherent in the multiple reflections, are particularly large. This is valid, for example, for multiple reflections that have originated from the sea-floor, especially if we deal with a rather deep sea. In very shallow shelf areas the normal deconvolution process generally suffices to attenuate the sea floer multiples, but it does not in deeper marine basins. Here, too, adequate processes are being developed which will be important in future oil exploration outside the |
||||
| | ||||
|
PRAKLA-SEISMOS Report 3 / 1974
|
||||
| Geophysics for Mining and Engineering | ||||
 proper shelf areas, and it is to be noted that oil and gas exploration increasingly moves to always greater depths of the sea floor. In the northern North Sea, to the east of the Shetland and Orkney Islands we al ready have producing oil fields in water depths of 130 and 140 m. We shall now take it for granted that we were able to produce seismograms which are to a high degree free of noise and also of multiple reflections due to the recording parameters applied in the field or at sea and by the first steps of data processing as e. g. Common-Reflection-Point-Stacking, by deconvolution and by long-Ieg-multiple attack. What else can be done with the records? There is primarily the question, where now lie the inhomo-geneities in the subsurface which appear in the seismograms. Previously one used to interpret the seismograms or seismogram sections, by marking certain reflection horizons and presenting them at their true position in the subsurface, not only at the right depths, but also with their lateral offsets. Expressed in another way, reflections were picked and migrated. For some years already this migration has been carried out directly, proceeding from the stacked seismograms (compare PRAKLA-SEISMOS Reports 1/72, 2/72, 3/72, 4/72, 1/74 and table on page 10). The method of this seismogram migration is based according to Bortfeld slmply on areversal of Huygen's |
||||
| | ||||
|
PRAKLA-SEISMOS Report 3 / 1974
|
||||
| Migration | ||||
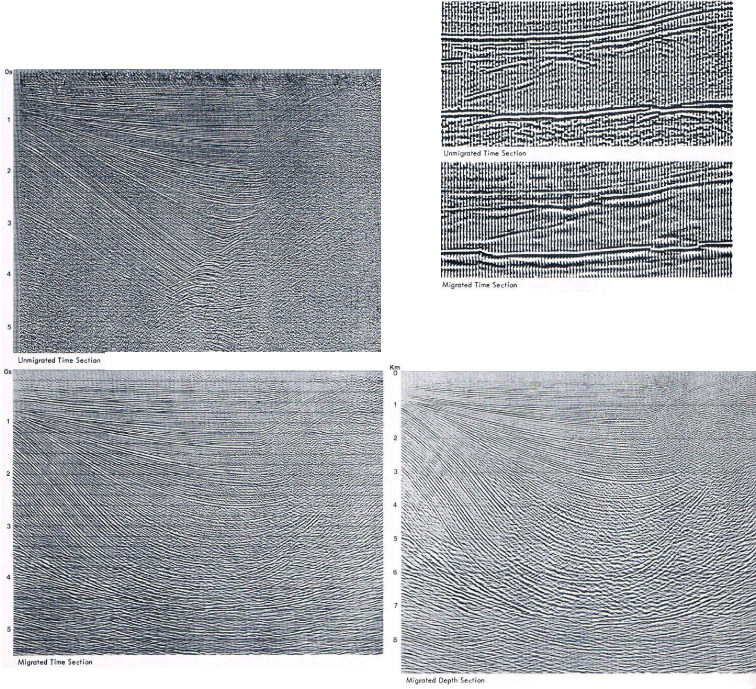 principle. For this, one divides the area of the depth section into small rectangles. A somewhat similar division al ready exists in the time domain in the digitally stacked seismogram section, where the values of the trace are entered in time intervals of 2 or 4 ms. Now for each rectangle of the depth section we check which value, that is which sampie of a certain seismogram trace could originate in this rectangle as a reflected or rather as a diffracted rayon account of its travel time. This procedure is performed on all traces which are recorded within a certain re ach of the little rectangle. 100 traces are commonly considered. All these selected values are now simply added. You have probably already noticed that to carry out this process we need to know the velocities in the subsurface. In the simplest case of a constant velocity the sampies to be selected in the unmigrated seismogram section lie on a certain hyperbola. Generally, however, these hyperbolae are modified according to the true velocities in the subsurface. They may grow rather complex if dipping or even curved velocity interfaces exist in the overburden. But even here we attempt to surmount the difficulties as can be seen by papers by Sattlegger, Dohr, and Stiller. After knowing that areversal of Huygen's principle by the digital computer can successfully be carried out |
||||
| | ||||
|
PRAKLA-SEISMOS Report 3 / 1974
|
||||
| Inverse Migration | ||||
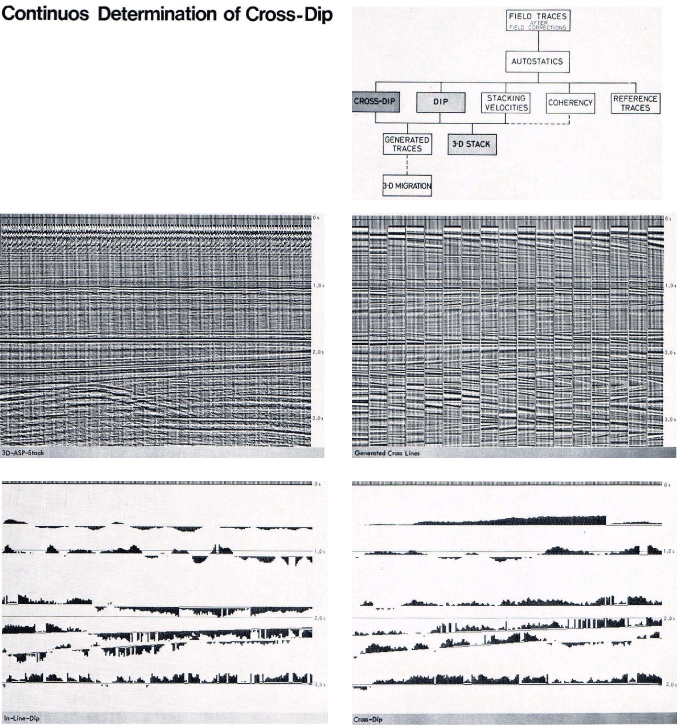
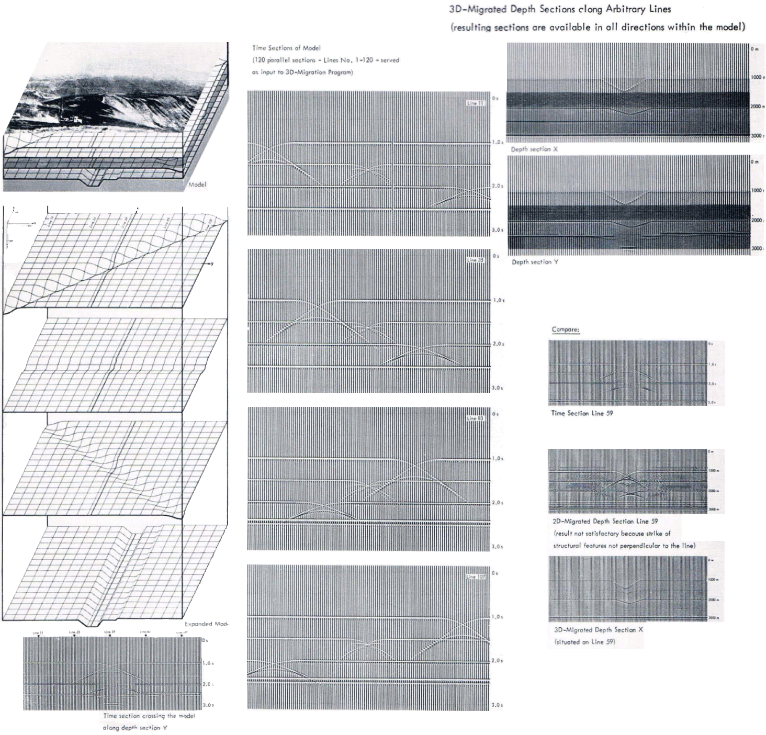
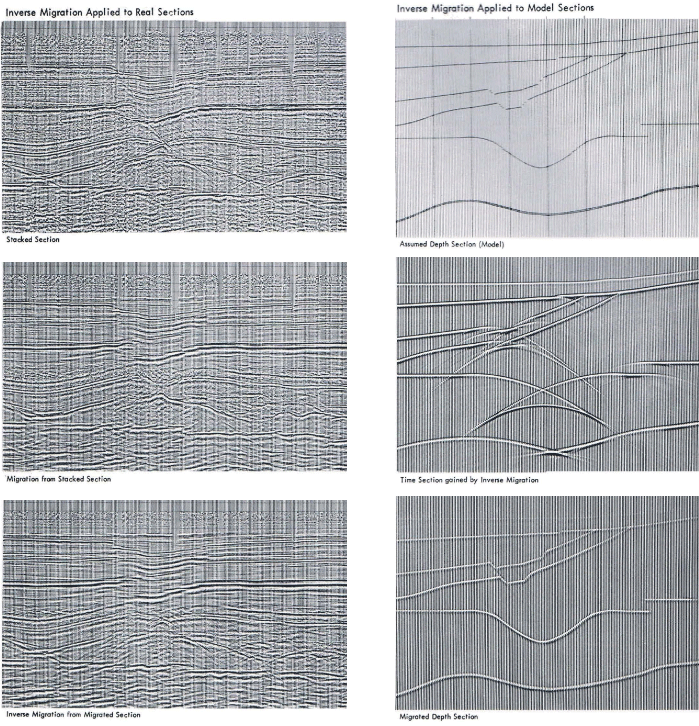 resulting in a localization of the inhomogenous interfaces in the subsurface fram the stacked seismogram sections, the idea was suggested to simulate the corresponding primary process, i. e. the computational determination of the stacked seismogram section if the reflecting interfaces in the subsurface are known. In the PRAKLA-SEISMOS Report 2/72 the result of such a model examination and the subsequent migration is shown which leads, quite satisfactorily, back to the original model (table on this page). The 2-dimensional migration which I had in mind in my considerations so far assumes that the recorded line runs normal to the strike of all the geologie horizons concerned. This assumption is however, very often not true, not even approximately. Nowadays therefore, the endeavour is to carry out a 3-dimensional, that is a spatial migration. The importance of this development can readily be seen in the table on page 15. This extension into the third dimension affords no new fundamental idea. While with two dimensions we proceed from a sequence of stacked seismogram traces which are obtained at fixed intervals on a straight I ine along the earth's surface, one now proceeds from a 2-dimensional manifold of stacked seismogram traces which may belong to the points of a square grid extending over the earth's surface. Further, the hyperbolalike curves, along which we |
||||
| | ||||
|
PRAKLA-SEISMOS Report 3 / 1974
|
||||
| ASP (Advanced Seismic Program System) | ||||
 add in the case of two dimensions are now replaced by hyperboloid-like surfaces. Spatial migration naturally requires a change in field techniques. Here various suggestions exist. For example, one can layout the geophones along a straight line and the shotpoints along a zigzag line whTch covers the geophone line in a wide strip (fig. 2). One can layout several parallel geophone lines and have the shotpoints or vibration points in the Vibroseis method on one of these lines etc., etc. PRAKLA-SEISMOS uses a most general three dimensional seismic field and data processing system which is part of the so-called extended ASP program. This program which was developed by Bortfeld and his team will be explained later on. According to Bortfeld's design the shotpoints lie at arbitrary lateral distances from the geophone line. A certain width of the whole shot hole strip should however, not be exceeded and a statistical equal-spacing should be aimed at if possible. By this principle one has in built-up areas considerably more possibilities to layout shotpoints than if one is tied to a fixed scheme. This kind of strip recording and the processing with the extended ASP-program provide as additional values, continuous information on the cross-dip i. e. the reflection time difference per unit length in the direction perpendicular to the line. The expected seismic traces at the above-mentioned grid points can then be computed whereby the necessary data |
||||
| | ||||
|
PRAKLA-SEISMOS Report 3 / 1974
|
||||
| ASP (Advanced Seismic Program System) | ||||
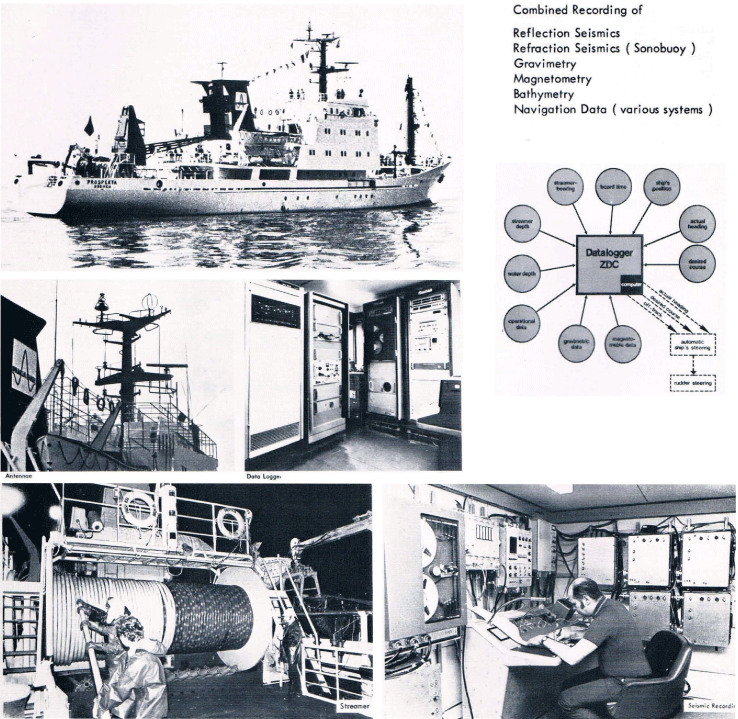
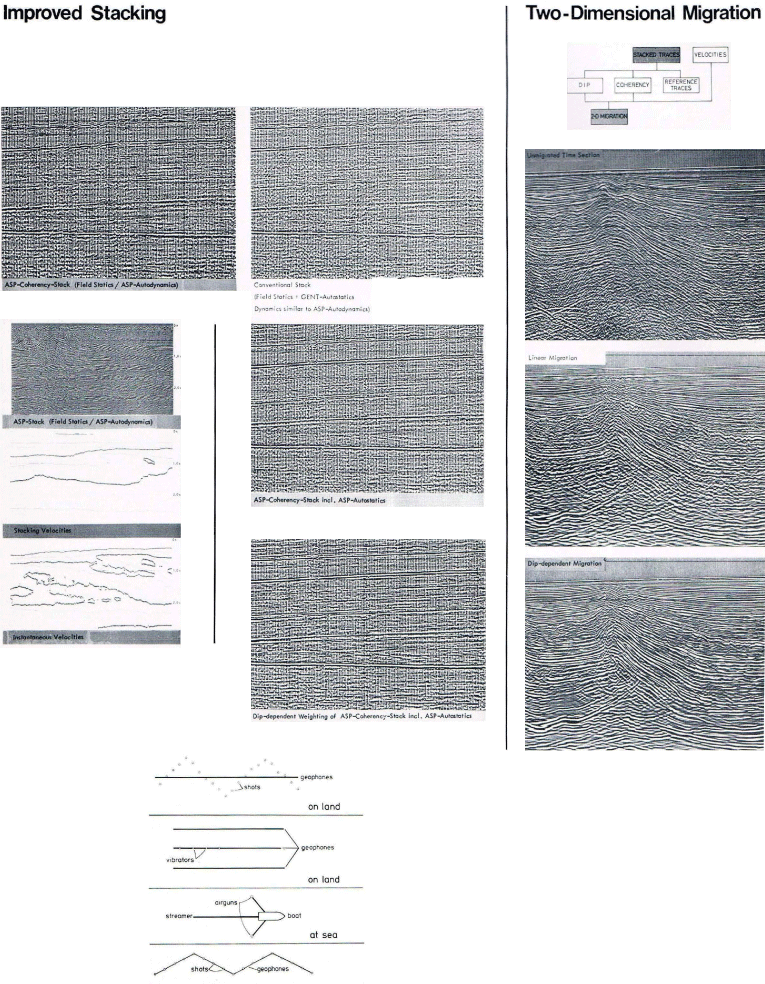 are obtained to start 3-dimensional migration after several such strip recordings have been carried out. Worth mentioning is that at sea, PRAKLA-SEISMOS determines the cross dip information by placing the airguns, which today commonly serve as energy source, below outriggers at lateraloffsets of 40 to 50 m from port and starboard sides of the vessel (fig. 2). In jungle areas we want to retain the shotpoints on the geophone line in order to avoid the labourious cutting of cross tracks offline for the placing of shotpoints. Instead, the geophone line, which is also the shotpoint line, will be a zigzag line with angles from 20° to a maximum of 30° to the direction of the line proper. The corners of the zigzag should have |
||||
| | ||||
|
PRAKLA-SEISMOS Report 3 / 1974
|
||||
| ASP (Advanced Seismic Program System) | ||||
 a spacing equal to approximately one half the maximum shot-geophone distance. In this manner too, continuous information can be obtained about the cross dip without causing noticeably greater field work. My discussions so far have concentrated on how to obtain seismograms which are free of interfering noise to a high degree and which contain, if possible, only primary reflections and in which the shotpoint and the recording point coincide. Further we showed how to obtain a true image of the structure features in the subsurface by 2-and 3-dimensional migration. I mentioned that the required knowledge of velocities in the subsurface can be obtained from the reflections them selves. In this respect, the most ingenuous method in my opinion is the ASP-program developed by Bortfeld about which I should now like to make some comments (tables on page 12, 13, 14, compare PRAKLA-SEISMOS Reports 2/73 and 2/74). Let us assume that all unstacked seismogram traces are clearly arranged, first according to progressive centre points between shot-and recording-Iocation, and then within all traces with one common such centre point, according to progressive distances between shot-and recording locations. The optimum dynamic correction and with this, the optimum stacking velocity may be known up to the Nth such trace ; further more the dip in the time |
||||
| | ||||
|
PRAKLA-SEISMOS Report 3 / 1974
|
||||
| Three-Dimensional Migration | ||||
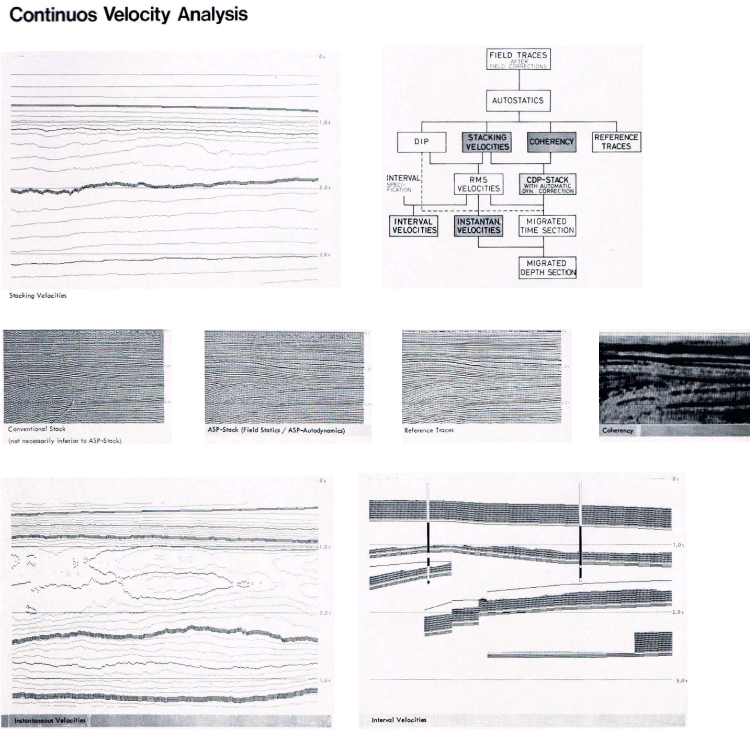
 domain and the most probable stacked trace which we call the reference trace. Also the coherence is assumed to be known, that is the measure of similarity of neighbouring traces. From the above magnitudes belonging to the Nth trace we now predict the reference trace for the (N +1 )th trace. By crosscorrelating the predicted (N +1)th reference trace with the actually observed (N +1 )th trace, we then determine how the abovementioned magnitudes (including the reference trace) have to be changed in order to get the most likely coincidence with observation. Starting with certain probable initial values, ASP thus continuously determines the change of the above magnitu des, the most interesting of which is the stacking velocity, that is, the velocity which results in the most satisfactory stacking. Practical calculations have proved that with erroneous initial values ASP finds out the correct values already after approx. 10 to 15 subsurface points. The effectiveness of the ASP-program is due to the fact that seismic waves are always continuous even with discontinuities in the geologic structure of the subsurface, as for example faults. In this respect I only need to remind you of diffraction phenomena. The table on page 12 shows the performance of the ASPprogram. From the stacking velocities represented in the upper left part, we can calculate the " instantaneous velocities" as shown in the lower left part. We deal here with |
||||
| | ||||
|
PRAKLA-SEISMOS Report 3 / 1974
|
||||
| Real Amplitude Processing Offshore | ||||
 the mean value of the velocity over a certain vertical interval which corresponds, for example, to arefleetion travel time difference of 200 ms. The velocities obtained require certain corrections when dealing with dipping and curved velocity interfaces. We call the velocities so obtained "geometrie velocities" as they result from the geometry of the seismic field work. I should now like to come back once again to seismogram migration. I told you that this method starts from the stacked CRP-traces. But this is in no way required; one can work as weil directly with the dynamically uncorrected single traces. Now, of course 6 to 24 times as many values have to be added for each little subsurface rectangle, but one avoids the imperfections as connected with CRPstacking. Even in this "rigorous migration from the start" as I might call it here, we have of course, the possibility to determine the "geometrie velocities" and especially the "instantaneous velocities" because the correct velocities result in the most satisfactory migration picture. In future, there will certainly be further development in this direction in spite of the required increased computing effort. The ASP-program and similar processes, with or without curvature and dip corrections, will always supply us only with mean velocities over certain larger intervals. The smaller this interval the less the accuracy becomes. If we |
||||
| | ||||
|
PRAKLA-SEISMOS Report 3 / 1974
|
||||
| Real Amplitude Processing Onshore | ||||
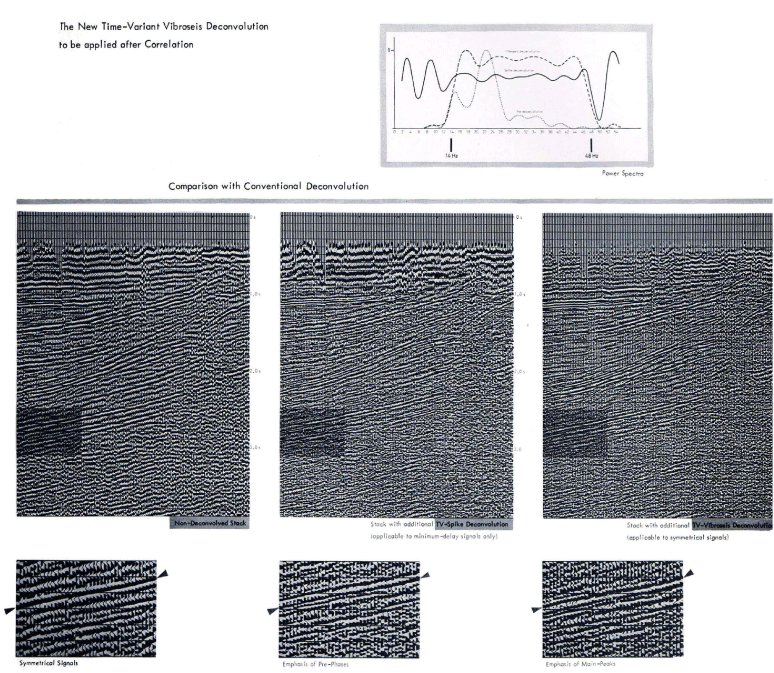
 require detailed velocity information we have to look for other methods. The solution which is offered here is the interpretation of amplitudes. As is weil known, with zero offset reflections the amplitude of the reflections in the pulse seismogram is only dependant on the relative change of the magnitude QX v, that is densityXvelocity. If we assume the less variable density to be known then by suitable integration we can determine the velocity as a function of depth, or expressed in another way, we can then compute an acoustic log from the seismogram. For this we need however, a pulse seismogram which only contains the primary reflections. Here we presently consider only the case of horizontal layering. Unfortunately our seismogram has been considerably alte red by filter processes in the subsurface and in the recording instrument. Moreover, the reflections still suffer interference from the remainder of undesired signals and noise, especially multiple reflections, although our endeavour has been to suppress this interference as far as possible by adequate recording and data processing techniques. It is now obvious why I stressed the importance of a high signalto-noise-ratio at the start of my discussion. Particularly burdensome for the calculation of the Acoustic Log from a seismogram seetion are the missing low frequencies between about 0 and 8 Hz.. Here, a combination of the instantaneous velocities, the geometrie |
||||
| | ||||
|
PRAKLA-SEISMOS Report 3 / 1974
|
||||
| Saltdome Undershooting | ||||
 |
||||
| | ||||
|
PRAKLA-SEISMOS Report 3 / 1974
|
||||
| Interpretation | ||||
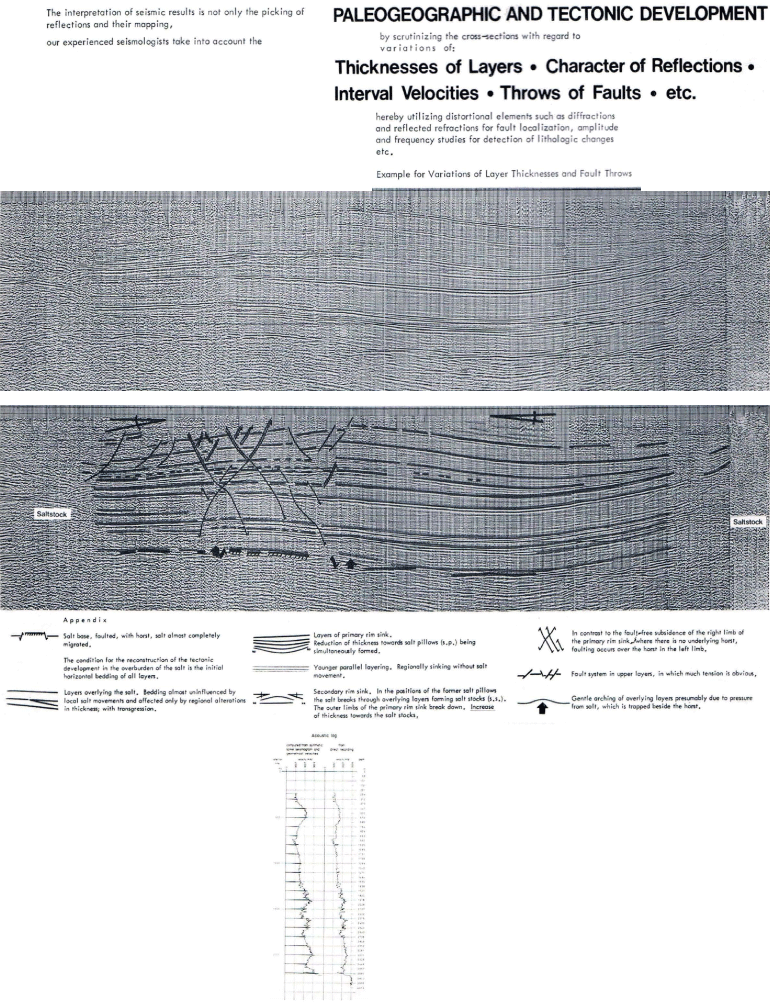 velocities, derived from ASP or similar programs with the above-mentioned integration of seismogram traces offers the possibility to surmount these difficulties. First steps in this direction have al ready been carried out by PRAKLASEISMOS (fig. 3). The strang absorption of high frequencies in the subsurface is of course another serious obstacle in the endeavour to determine the Acoustic Log from the seismograms, especially because it prevents us from cancelling by deconvolution the many high-frequency reverberations which are generated by the fine structure in the geologie bedding and which may have a greater effect, according to Anstey, on the seismogram than the real sequence of |
||||
| | ||||
|
PRAKLA-SEISMOS Report 3 / 1974
|
||||
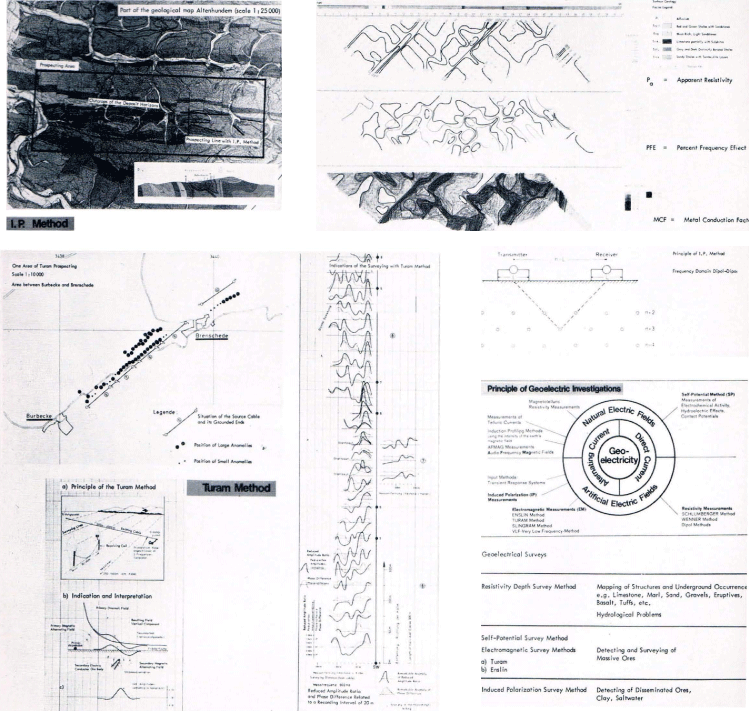
| Geoelectrics | ||||
 reflecting interfaces. Thus, a satisfying way to the "pseudo acoustic log" derived from seismic field records has not yet been found out. More useful information can be derived nowadays by studying lateral amplitude variations as compared to vertical ones. Here I especially mean the change of reflection amplitudes with the kind of pore filling of a certain geological bed. The seismic compressional wave velocity in not too consolidated sediments can significantly depend on whether the pore spaces are filled with gas or fluid. Considerable amplitude differences in the reflections can thus be caused which make gas fields and the gas water edge line directly recognizable. In areas of rapid sedimentation, the interesting beds very often remain rather unconsolidated to appreciable depths. On account of these facts Diekmann and Wierczeyko have been able to draw important conclusions from observations that had already been made in 1966 above subterranean gas storage facilities of the Ruhrgas Co. In 1973, Schmoll elaborated this subject and presented the result at the EAEG-meeting in Brighton. In this case the velocity in sand were about 1200 m/s when filled with gas and about 1800 m/s when filled with water (see PRAKLA-SEISMOS Report 3/72). In the past few years similar observations have been made on offshore sections (page 16). Here one talks about |
||||
| | ||||
|
PRAKLA-SEISMOS Report 3 / 1974
|
||||
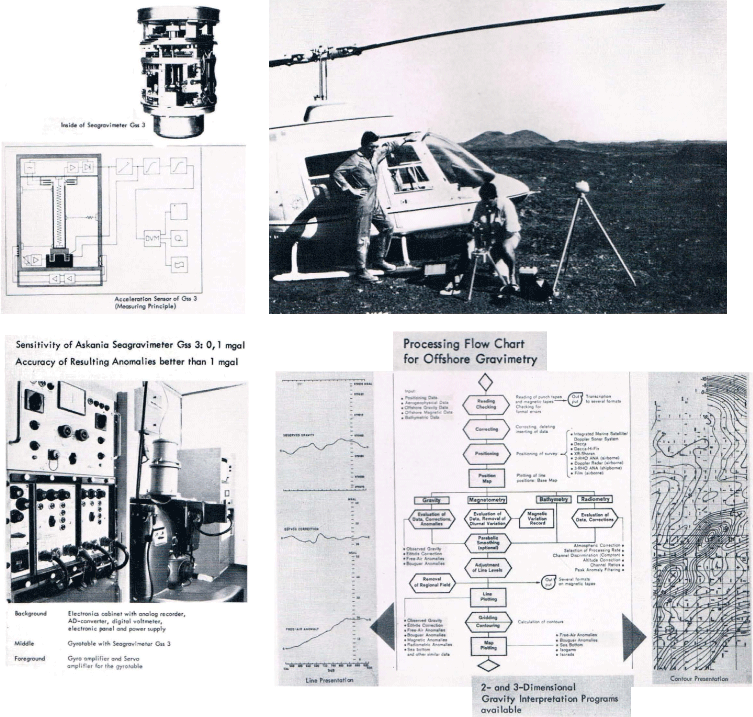
| Gravimetry | ||||
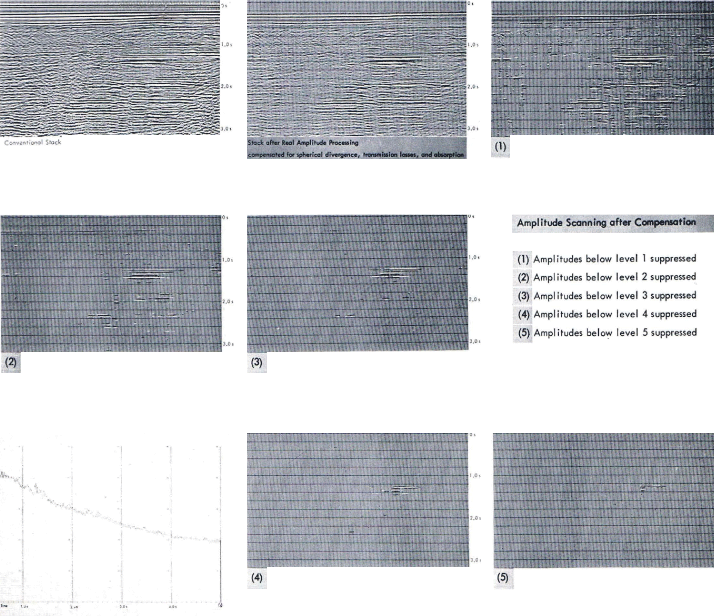
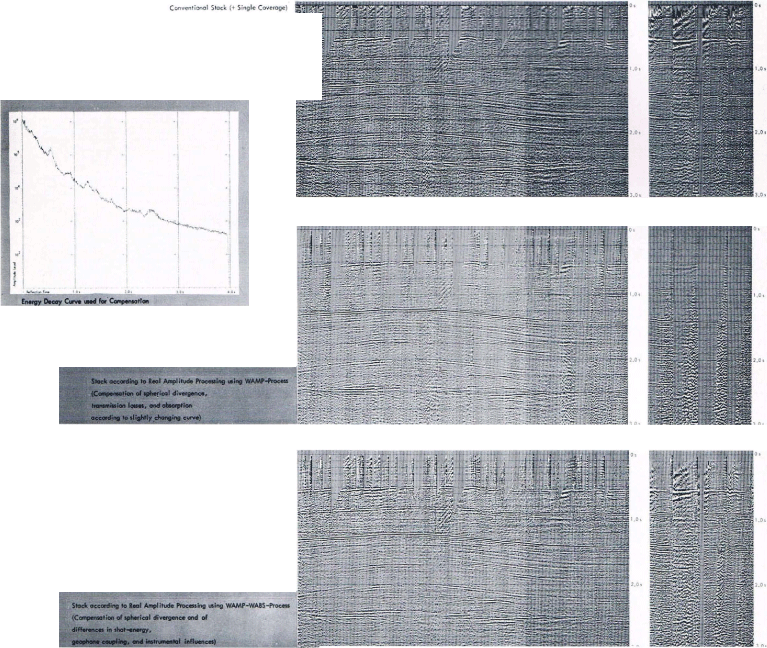
 "hot spots" and "bright spots". In many cases, including the example shown, these "bright spots" have in the meantime been confirmed to be caused by gas-filled layers. These, commonly quite shallow gas fjelds, are not necessarily of commercial interest, but they are in many cases indicative of oil in greater depths. Due to these reasons it is not surprising that we not only try to produce weil interpretable seismogram sections with the aid of suitable amplitude gain control and normalization procedures but also to retain the real amplitude relations in a quantitatively easily reproducible manner. Colour scales are often used to represent the differences in amplitudes. Another possibility of representation is shown in the table on page 16. I have already mentioned that the aim is to obtain indications of the magnitude QX v (density X velocity) from the amplitudes of the seismogram traces. If we want to determine the two magnitudes Q and v independently of each other, and there are no borehole density logs, we may shoot with very small shot-geophone distances and additionally with very large ones. With very large reflection angles, at the latest in the range of the critical angle, the dependence of the reflection coefficient on Q X v passes into one of v alone. There are other reasons too, to use a large shot-geophone spacing. There is first the more effective attenuation of |
||||
| | ||||
|
PRAKLA-SEISMOS Report 3 / 1974
|
||||
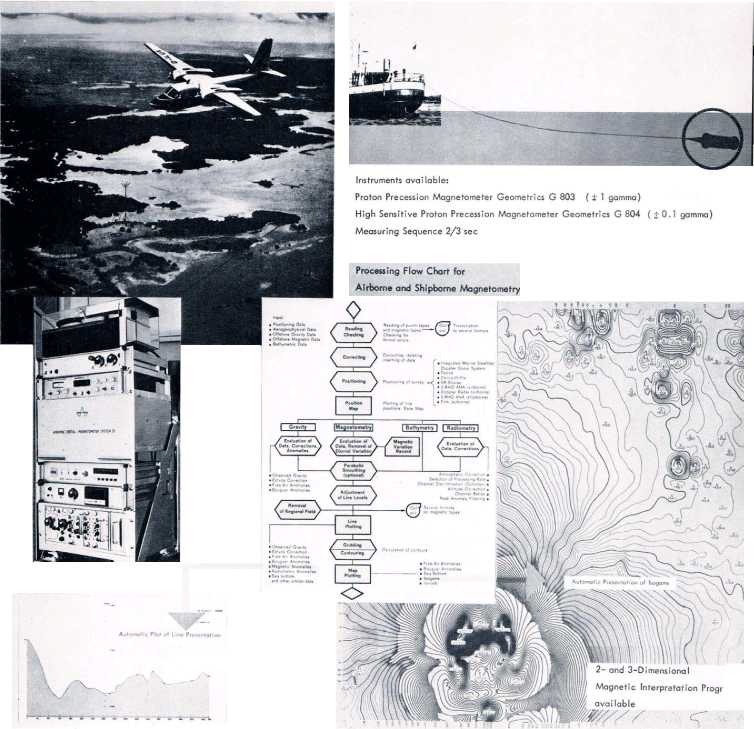
| Magnetometry | ||||
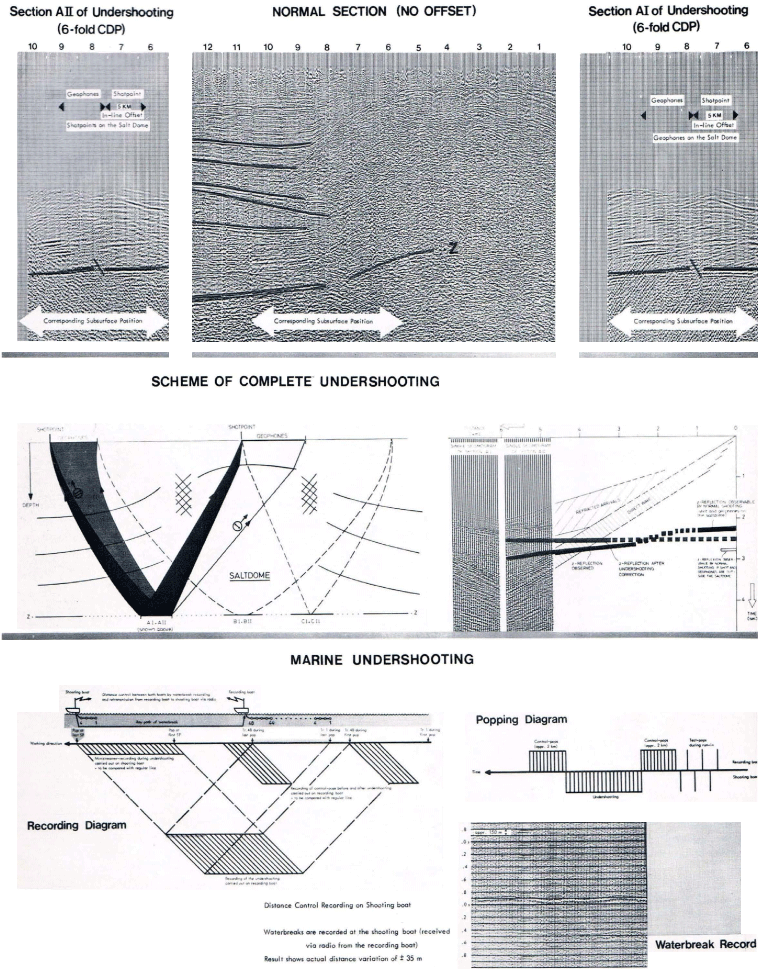
 multiple refleetions by CRP staeking and, what is elosely eonneeted to this the inerease in aeeuraey in the eomputation of the geometrie veloeities as weil as possible information on anisotropy. Furthermore, a large shotgeophone spaeing offers the possibility to undershoot eomplieated bodies whieh are sometimes eneountered above rather interesting geologieal horizons. I am thinking here partieularly of the undershooting of saltdomes (see table on page 18). I may summarize that we are presently in aperiod of an espeeially intensive development in applied refleetion seismies. Geophysieists have realized the great potential that is eontained in the two dimensions of the veetor from the shotpoint to the geophone loeation at the earth's surfaee as weil as in the real amplitude relations. With the first two dimensions it has now beeome possible to reeognize more elearly and loealize more preeisely the diseontinuities in the subsurfaee and also to determine the "instantaneous veloeities". The eonventional CRP-staeking will in future probably widely be replaeed by the immediate migration of single-shot seismograms. The real amplitude in the seismogram is inereasingly being evaluated in the endeavour to get direct indieations on natural gas and under favourable eonditions on oil as weil. Work is also in progress to obtain details on the veloeity as a function of depths (pseudo aeoustic log). |
||||
| | ||||
|
PRAKLA-SEISMOS Report 3 / 1974
|
||||
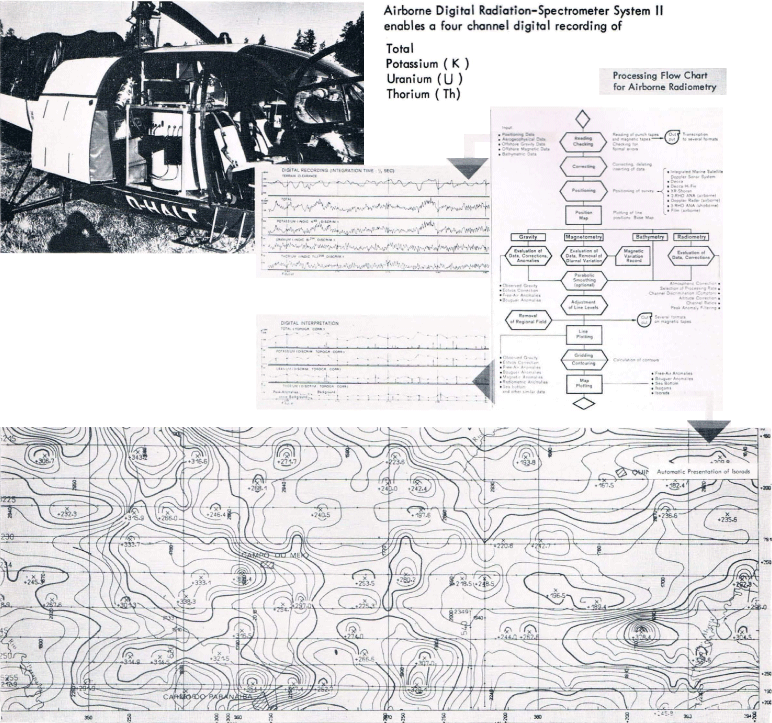
| Radiometry | ||||
 |
||||
|
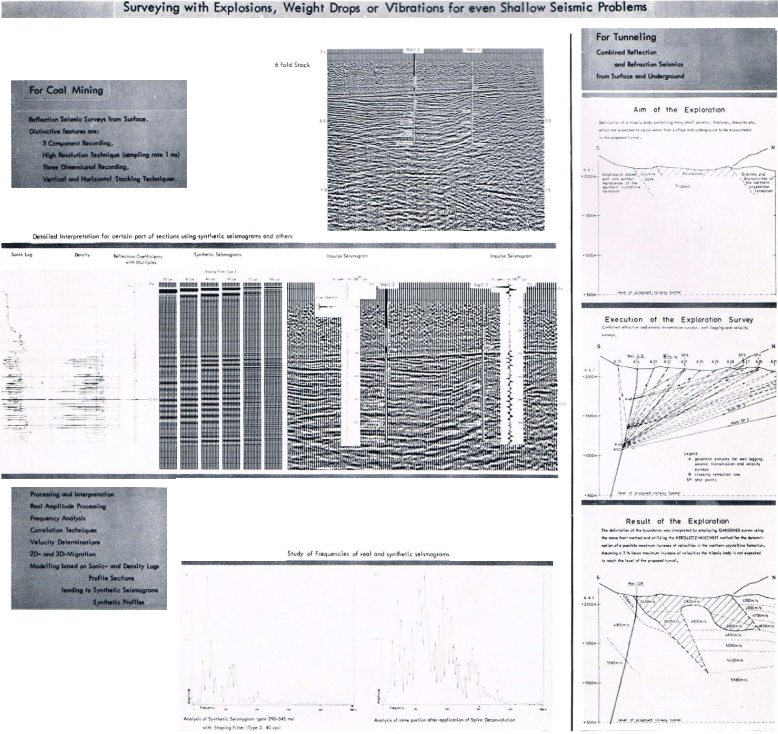
I have not discussed refraction seismics, nor surveys with guided waves which are utilized for example in mines (see PRAKLA-SEISMOS Report 1/71). Here, not too much has happened in the last few years, although many processes have been transferred fram normal reflection seismics to these special methods as for example, prediction error filtering and migration refraction (compare Report 1/73) and CRP-stacking to coal seam seismics but this is outside the scope of the present report. Before finishing, I should like to give you an impression of the wealth of structural information which is inferred from a modern seismic section as may be seen from the table on page 19. |
Literature Bortfeld: Seismic and Optical Imaging, Paper presented at the 33rd EAEG- Sattlegger, Dohr, Stiller: Migration Velocity Determination, Paper presented at O'Doherty, Anstey: Rellections on Amplitudes, Geophysical Prospecting, Diekmann, Wierczeyko: A Possible Method lor Determining the Extent of Glocke, Lemcke, Schmoll: Rellection Seismic Control 01 the Edge Water Lines PRAKLA-SEISMOS Reports: |
|||
| | ||||
|
PRAKLA-SEISMOS Report 3 / 1974
|
||||
| PRAKLA-SEISMOS Services | ||||
|
Reflection Seismic Surveys on Land Refraction Seismic Surveys on Land Marine Seismic Surveys Marine Gravity Surveys Marine Magnetic Surveys Amphibious Seismic Surveys Airborne Magnetic Surveys Airborne Radiation Spectrometer Surveys |
Radio Navigation Geodetic Surveys Gravity and Magnetic Surveys on land. Geoelectric Surveys Velocity Surveys Cavern Surveys Shallow Borehole Logging Saltdome Surveys Seismic Surveys in Mines Data Processing Interpretation Shallow Drilling |
|||
| | ||||
|
PRAKLA-SEISMOS Report 3 / 1974
|
||||
| PRAKLA-SEISMOS Sales Program | ||||
|
Complete Geophysical Systems Integrated Navigation Systems Acquisition Systems for Additional Survey Data
For geophysical and oceanographic exploration: |
Aero Navigation System Digital Plotter Drilling Equipment |
|||