Eine automatische Geschwindigkeitsanalyse
Um dem Wunsch einiger unserer Kunden gerecht zu werden, wurde im PRAKLA-SEISMOS-Datenzentrum nun auch ein Programm entwickelt, mit dem Geschwindigkeitsanalysen in Form von Isolinien dargestellt werden können.
Das neue Programm heißt ALYS und ist vorläufig noch in drei Bearbeitungsschritte aufgeteilt:
- Kohärenzuntersuchung der korrigierten Spuren eines Untergrundpunktes mit dem Modul ALYS (im GEOPLAN-Programmsystem),
- Gridding (auf ein Gitter-Bringen) der von 1) gelieferten Wertepaare mit dem Steuerwort ALYS (im DSY-Programmsystem),
- Plotten der Ergebnisse in Form von Isolinien (Linien gleicher Kohärenz) in einem Koordinatensystem VRMS/T auf dem Calcomp-Plotter.
Ausgangsmaterial für eine automatische Geschwindigkeitsanalyse ALYS sind die unkorrigierten Spuren eines mehrfachüberdeckten Untergrundpunktes. In mehreren Korrekturläufen werden die Spuren jeweils mit abgewandelten Geschwindigkeiten dynamisch korrigiert. In ALYS wird innerhalb eines Fensters anwählbarer Breite das Maß der Ähnlichkeit (Kohärenz) der korrigierten Spuren gemessen. Das Fenster wird über die ganze Spur sampleweise verschoben. Die Ausgabe der Wertepaare Durchschnittsamplitude/Geschwindigkeit auf die "Zielspur" erfolgt alle 16 msec. Dieser Abstand entspricht auch dem Gitterabstand bei der späteren graphischen Darstellung.
Following the wish expressed by several of our clients a program has been developed in the PRAKLA-SEISMOS Data Centre, with which velocity analyses can be depicted in the form of isograms.
The new program is called ALYS, and for the time being it is still divided into three steps:
- Coherence testing with the ALYS module (in the GEOPLAN program system) of the corrected traces of a common depth point,
- Gridding of the value pairs resulting from step 1. with the control word ALYS in the DSY program system,
- Plotting of the results as isograms (Iines of equal coherence) in a coordinate system VRMS/T with the Calcomp Plotter.
The basic data for an ALYS automatic velocity analysis are the uncorrected traces from a common depth point. In several correction runs the traces are given dynamic corrections, each time with altered velocities. In ALYS the degree of comparability (coherence) of the corrected traces can be measured in a window of chosen width. The window is shifted across the whole trace sampie by sampie. The results of the value pairs' average amplitude/velocity on the "end trace " is taken every 16 msecs. This interval corresponds to the grid interval of the subsequent graphie presentation. Values of equal coherence can be depicted with the Calcomp Plotter, dependant on the travel times and RMS-velocities with a chosen elevation scale.
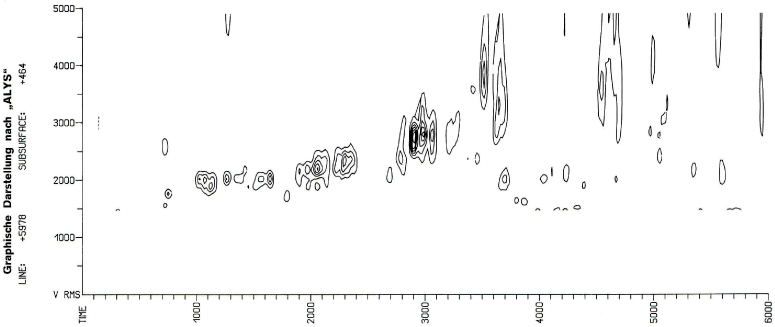
Die Werte gleicher Kohärenz können in wählbarer überhöhung in Abhängigkeit von Laufzeit und RMSGeschwindigkeit durch den Calcomp-Plotter dargestellt werden.
Der automatische Prozess ALYS ist eine Ergänzung des Programmsystems, der dem Auswerter für eine schnelle und übersichtliche Beurteilung der Geschwindigkeitsverhältnisse im Meßgebiet nützlich sein kann. Keinesfalls sollen bewährte Programme zur Bestimmung der dynamischen Korrekturen und der Geschwindigkeiten wie GEAN oder GENT dadurch ersetzt werden.
Das Beispiel stellt das "ALYS " eines 24fach überdeckten Untergrundpunktes dar.
The automatie ALYS process is a completion of the program system which the interpreter will surely find useful for a fast, general estimation of velocity conditions in the survey area. In no circumstances should ALYS replace approved programs for determining dynamic corrections and velocities, such as GEAN or GENT.
The example shows the ALYS of a 24-fold coverage of a common depth point.